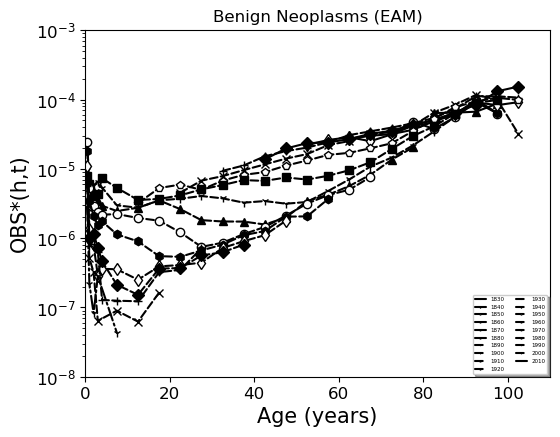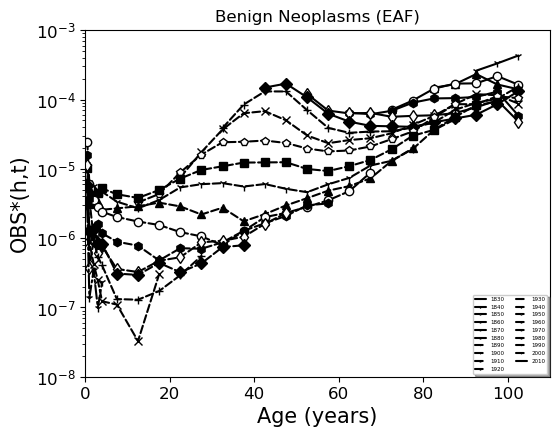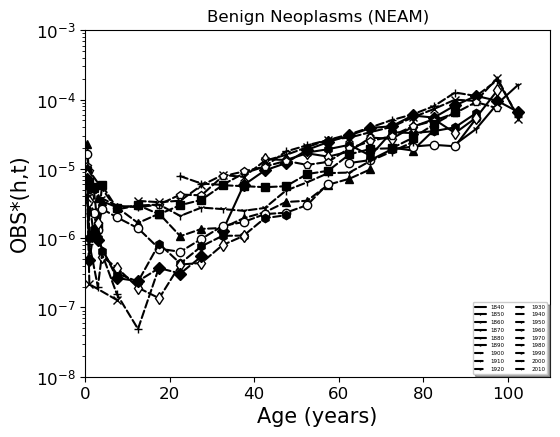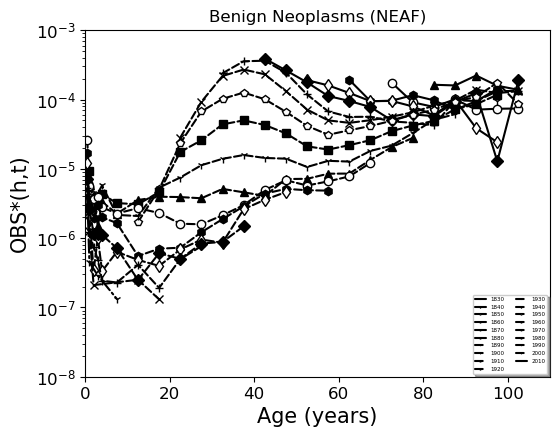

Benign Neoplasms
|
Download Data |
|
|
| [Download Excel Datasheet for Benign Neoplasms] |
|
| [Download TAB-delimited TXT files for all plots] |
Click on any race to visualize OBS*(h,t) for each decade in detail:
Click on any time average period to visualize OBS*(h,y) plots in detail:
[(EAM) OBS*(h,y) five year cohorts , (EAM) OBS*(h,y) ten year cohorts]Click on any time average period to visualize OBS*(t,y) plots in detail:
[(EAM) OBS*(t,y) five year cohorts , (EAM) OBS*(t,y) ten year cohorts]

|

|

|

|