
CancerFit Sample Results for Cancer of the Lower GI Tract
Clicking on any cell in the following tables will open a new page showing the top fits, along with values of the parameters that resulted in those top fits. The first column shows the GOF(h,t) for each fit, the remaining columns shows the values of the parameters, as well as other calculated variables, such as the area under the curve CAL(g) and the fraction initiation, Finit.
- Table 1. [ view table ]
- Complete matrix of GOF(h) for m = 1,2,3,4,5 and n = 1,2,3,4,5 with the assumption of inhomogeneous risk, i.e., the parameter “F” representing a hypothetical fraction of the population at risk was allowed to range from 0 to 1, and function representing synchronous forms of mortality was allowed to vary from 0 to 1. Values of (PiiRi)1/n and (PiA RA)1/m were permitted to range from 10-9 to 100 and the range of
 was set at 0.1 to 0.3. The values of GOF(h) ranged from 0.035 (n = 3, m = 4) to 0.064 ( n = 3, m=5). The value of 0.043 was the minimum GOF(h) observed for n = 2, m = 1.
- F = 0.01 .. 1 over nF = 20 iterations
- f = 0.01 .. 1 over nf = 20 iterations
- = 0.1 .. 0.3 over n = 20 iterations
- (PiiRi)1/n = 1E-9 .. 1E0 over nRinitation = 100 iterations
- (PiA RA)1/m = 1E-9 .. 1E0 over nRpromotion = 100 iterations
- Complete matrix of GOF(h) for m = 1,2,3,4,5 and n = 1,2,3,4,5 with the assumption of inhomogeneous risk, i.e., the parameter “F” representing a hypothetical fraction of the population at risk was allowed to range from 0 to 1, and function representing synchronous forms of mortality was allowed to vary from 0 to 1. Values of (PiiRi)1/n and (PiA RA)1/m were permitted to range from 10-9 to 100 and the range of
- Table 2. [ view table ]
- Complete matrix of GOF(h) for m = 1,2,3,4,5 and n = 1,2,3,4,5 with the assumption of inhomogeneous risk, i.e., the parameter “F” representing a hypothetical fraction of the population at risk was allowed to range from 0 to 1 (F < 1; f = 1). Values of (PiiRi)1/n and (PiA RA)1/m were permitted to range from 10-9 to 100 and the range of was set at 0.1 to 0.3. The values of GOF(h) ranged from 0.035 (n = 3, m = 4) to 0.064 ( n = 3, m=5). The value of 0.043 was the minimum GOF(h) observed for n = 2, m = 1.
- F = 0.01 .. 1 over nF = 20 iterations
- f = 1 over nf = 1 iteration
- = 0.1 .. 0.3 over n = 20 iterations
- (PiiRi)1/n = 1E-9 .. 1E0 over nRinitation = 100 iterations
- (PiA RA)1/m = 1E-9 .. 1E0 over nRpromotion = 100 iterations
- Complete matrix of GOF(h) for m = 1,2,3,4,5 and n = 1,2,3,4,5 with the assumption of inhomogeneous risk, i.e., the parameter “F” representing a hypothetical fraction of the population at risk was allowed to range from 0 to 1 (F < 1; f = 1). Values of (PiiRi)1/n and (PiA RA)1/m were permitted to range from 10-9 to 100 and the range of
- Table 3. [ view table ]
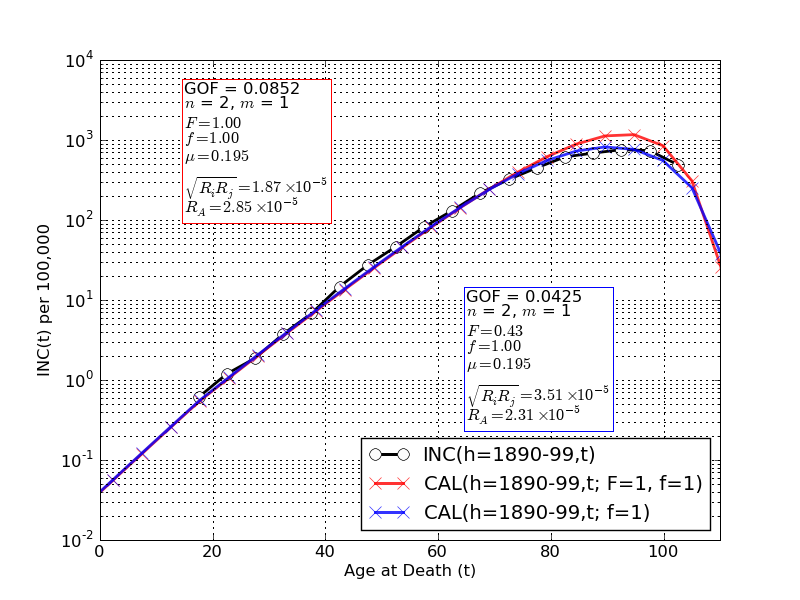
- Complete matrix of GOF(h) for m = 1,2,3,4,5 and n = 1,2,3,4,5 calculated under the parsimonious conditions of homogeneous risk and no synchronous mortal diseases sharing risk factors with colorectal cancer (F = 1; f = 1). Values of (PiiRi)1/n and (PiA RA)1/m were permitted to range from 10-9 to 100 and the range of ? was set at 0.1 to 0.3. The value of 0.052 was the minimum GOF(h) observed for n = 4, m =2. For n = 2, an appropriate biological value if only the loss of both copies of the APC gene were necessary and sufficient for initiation in most colorectal cancers, and m = 1, a default assumption absent any evidence about mutations required for promotion, the GOF(h) was 0.085.
- F = 1 over nF = 1 iteration
- f = 1 over nf = 1 iteration
- = 0.1 .. 0.3 over n = 20 iterations
- (PiiRi)1/n = 1E-9 .. 1E0 over nRinitation = 100 iterations
- (PiA RA)1/m = 1E-9 .. 1E0 over nRpromotion = 100 iterations
- Complete matrix of GOF(h) for m = 1,2,3,4,5 and n = 1,2,3,4,5 calculated under the parsimonious conditions of homogeneous risk and no synchronous mortal diseases sharing risk factors with colorectal cancer (F = 1; f = 1). Values of (PiiRi)1/n and (PiA RA)1/m were permitted to range from 10-9 to 100 and the range of ? was set at 0.1 to 0.3. The value of 0.052 was the minimum GOF(h) observed for n = 4, m =2. For n = 2, an appropriate biological value if only the loss of both copies of the APC gene were necessary and sufficient for initiation in most colorectal cancers, and m = 1, a default assumption absent any evidence about mutations required for promotion, the GOF(h) was 0.085.
The following figure depicts the degree of concordance of the two trial conditions: F = 1, f = 1 (population homogeneity, no synchronous competing risk) and F < 1, f =1 (population inhomogeneity, no synchronous competing risk)) with adult lifetime incidence data for lower G.I. tract cancer in European American males born 1890-99 INC(h,t). The model presented herein incorporating the observation of limitation of mutation to the fetal/juvenile period but without the assumption of risk stratification fits the data well except at extreme old age.
Address correspondence to: Lohith Kini ( )
)